Last Frost Dates by State: 10%, 50% and 90% Odds Tables
Frost dates vary more within a state than most charts suggest. In Colorado, the median last spring freeze ranges from mid-April to late June depending on the station. In California, it spans four months. A single “state frost date” doesn’t help anyone, so each state page lists real NOAA stations, with the spread of dates for each.
For the dates at your exact location, use the ZIP code lookup. It matches you to the nearest station.
TL;DR:
- Each state page lists real NOAA stations with spring and fall 32°F dates from the 1991-2020 Climate Normals, at 10%, 50% and 90% odds.
- The 50% date is what most charts call the “last frost date,” and it’s a coin flip. Wait for the 10% date if you want only one spring in ten to freeze later.
- Dates vary a lot inside one state. In Colorado, Boulder (1,672 m) has a median last freeze of May 6, and Boulder 14 W (2,996 m) has June 21.
- For your own garden, use the ZIP code lookup, which matches you to the nearest station.
How to read the tables
The columns
Every state page uses the same columns, all taken from NOAA’s 1991-2020 Climate Normals:
- Last 32°F (spring): 90% / 50% / 10%. There’s a 90% chance of a freeze after the first date, 50% after the second and 10% after the third. The 50% date is what most charts call the “last frost date.” It’s a coin flip, not a safe date. Waiting for the 10% date means only one spring in ten freezes later. Counting both ends, roughly one year in five falls outside the 90% to 10% range.
- First 32°F (fall): 10% / 50% / 90%. There’s a 10% chance the first freeze has come by the first date, 50% by the second and 90% by the third.
- Median season: NOAA’s median growing-season length at 32°F, in days.
- Data: NOAA’s completeness flag. S (standard) meets WMO data standards for 24 or more years. R (representative) meets them for 10 or more years. In both cases NOAA fills missing months from surrounding stations. E (estimated) has at least 2 years of data, with the normals estimated statistically from nearby standard stations. Treat E stations with more caution.
- Warm stations: where a freeze doesn’t happen every year, NOAA also gives the percentage of years with one, and the dates describe timing if a freeze happens. State pages show that percentage next to the dates.
Which date should you plan with? NC State Extension’s guide to these tables sums up the safe end: “10%: High precision, low risk. Use this date for risk-averse / conservative decision-making.”
Want odds for a date in between? See Frost Odds by ZIP: Your Chance of Frost After Any Date.
Your garden vs. the station
The dates belong to the station, not your garden. A garden in a frost pocket, on a hillside or near a large lake can differ from the station by “a week or more,” as our methodology page puts it. A big elevation gap can matter far more. Colorado shows how far it can go. The station at Boulder (1,672 m) has a median last freeze of May 6, while Boulder 14 W (2,996 m) has June 21. The Colorado page has the details.
State index
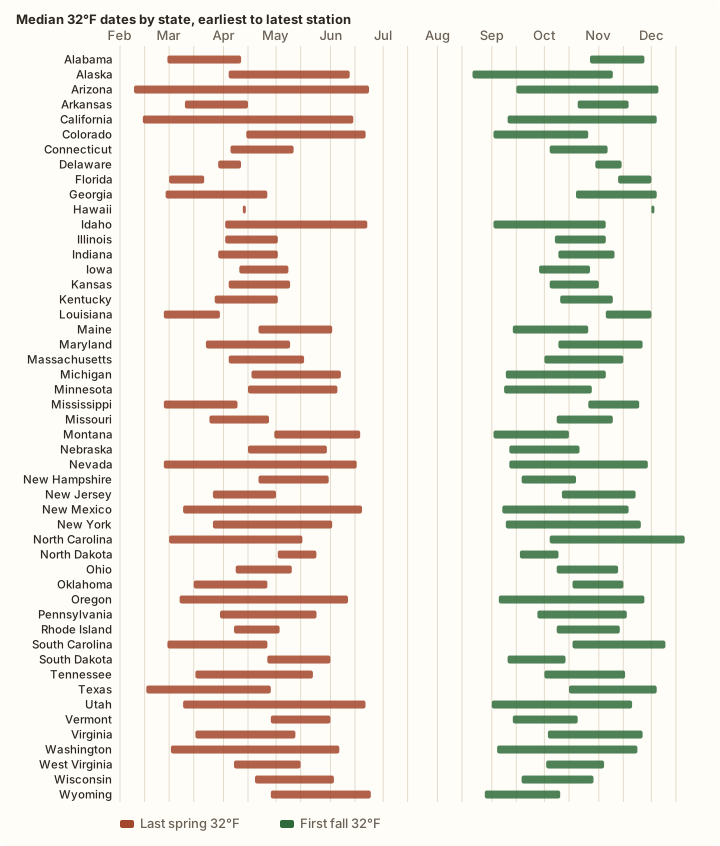
Median dates for every state
Each row summarizes all qualifying NOAA stations in the state. The date ranges show the earliest and latest median (50%) date among stations where it freezes every year. Stations where it doesn’t freeze every year are counted in the last column and left out of the ranges. In warm states that matters. Florida’s range comes from only the 20 of its 139 stations that freeze every year, and all 20 are at 29.6°N or farther north, so it describes north Florida only. The same applies to California, Texas, Arizona and Louisiana. Check the last column before reading too much into a range.
Colorado is the first state with a full station page. Follow the Colorado link in the table to see every station.
| State | NOAA stations | Median last 32°F, earliest to latest station | Median first 32°F, earliest to latest station | Stations without a freeze every year |
|---|---|---|---|---|
| Alabama | 118 | Feb 28 to Apr 11 | Oct 27 to Nov 27 | 7 |
| Alaska | 163 | Apr 4 to Jun 12 | Aug 21 to Nov 9 | 0 |
| Arizona | 174 | Feb 9 to Jun 23 | Sep 15 to Dec 5 | 50 |
| Arkansas | 112 | Mar 10 to Apr 15 | Oct 20 to Nov 18 | 0 |
| California | 332 | Feb 14 to Jun 14 | Sep 10 to Dec 4 | 199 |
| Colorado | 210 | Apr 14 to Jun 21 | Sep 2 to Oct 26 | 0 |
| Connecticut | 23 | Apr 5 to May 11 | Oct 4 to Nov 6 | 0 |
| Delaware | 7 | Mar 29 to Apr 11 | Oct 30 to Nov 14 | 0 |
| Florida | 139 | Mar 1 to Mar 21 | Nov 12 to Dec 1 | 119 |
| Georgia | 126 | Feb 27 to Apr 26 | Oct 19 to Dec 4 | 7 |
| Hawaii | 2 | Apr 12 to Apr 12 | Dec 1 to Dec 1 | 1 |
| Idaho | 127 | Apr 2 to Jun 22 | Sep 2 to Nov 5 | 0 |
| Illinois | 170 | Apr 2 to May 2 | Oct 7 to Nov 5 | 0 |
| Indiana | 117 | Mar 29 to May 2 | Oct 9 to Nov 10 | 0 |
| Iowa | 150 | Apr 10 to May 8 | Sep 28 to Oct 27 | 0 |
| Kansas | 176 | Apr 4 to May 9 | Oct 4 to Nov 1 | 0 |
| Kentucky | 97 | Mar 27 to May 2 | Oct 10 to Nov 9 | 0 |
| Louisiana | 98 | Feb 26 to Mar 30 | Nov 5 to Dec 1 | 41 |
| Maine | 82 | Apr 21 to Jun 2 | Sep 13 to Oct 26 | 0 |
| Maryland | 43 | Mar 22 to May 9 | Oct 9 to Nov 26 | 0 |
| Massachusetts | 69 | Apr 4 to May 17 | Oct 1 to Nov 15 | 0 |
| Michigan | 211 | Apr 17 to Jun 7 | Sep 9 to Nov 5 | 0 |
| Minnesota | 179 | Apr 15 to Jun 5 | Sep 8 to Oct 28 | 0 |
| Mississippi | 94 | Feb 26 to Apr 9 | Oct 26 to Nov 24 | 5 |
| Missouri | 171 | Mar 24 to Apr 27 | Oct 8 to Nov 9 | 0 |
| Montana | 216 | Apr 30 to Jun 18 | Sep 2 to Oct 15 | 0 |
| Nebraska | 184 | Apr 15 to May 30 | Sep 11 to Oct 21 | 0 |
| Nevada | 109 | Feb 26 to Jun 16 | Sep 11 to Nov 29 | 9 |
| New Hampshire | 54 | Apr 21 to May 31 | Sep 18 to Oct 19 | 0 |
| New Jersey | 48 | Mar 26 to May 1 | Oct 11 to Nov 22 | 0 |
| New Mexico | 175 | Mar 9 to Jun 19 | Sep 7 to Nov 18 | 0 |
| New York | 176 | Mar 26 to Jun 2 | Sep 9 to Nov 25 | 0 |
| North Carolina | 187 | Mar 1 to May 16 | Oct 4 to Dec 20 | 1 |
| North Dakota | 125 | May 2 to May 24 | Sep 17 to Oct 9 | 0 |
| Ohio | 130 | Apr 8 to May 10 | Oct 8 to Nov 12 | 0 |
| Oklahoma | 193 | Mar 15 to Apr 26 | Oct 17 to Nov 15 | 0 |
| Oregon | 172 | Mar 7 to Jun 11 | Sep 5 to Nov 27 | 21 |
| Pennsylvania | 160 | Mar 30 to May 24 | Sep 27 to Nov 17 | 0 |
| Rhode Island | 11 | Apr 7 to May 3 | Oct 8 to Nov 13 | 0 |
| South Carolina | 103 | Feb 28 to Apr 26 | Oct 17 to Dec 9 | 3 |
| South Dakota | 166 | Apr 26 to Jun 1 | Sep 10 to Oct 13 | 0 |
| Tennessee | 148 | Mar 16 to May 22 | Oct 1 to Nov 16 | 0 |
| Texas | 476 | Feb 16 to Apr 28 | Oct 15 to Dec 4 | 118 |
| Utah | 169 | Mar 9 to Jun 21 | Sep 1 to Nov 20 | 0 |
| Vermont | 45 | Apr 28 to Jun 1 | Sep 13 to Oct 20 | 0 |
| Virginia | 125 | Mar 16 to May 12 | Oct 3 to Nov 26 | 0 |
| Washington | 154 | Mar 2 to Jun 6 | Sep 4 to Nov 23 | 4 |
| West Virginia | 99 | Apr 7 to May 15 | Oct 2 to Nov 4 | 0 |
| Wisconsin | 204 | Apr 19 to Jun 3 | Sep 18 to Oct 29 | 0 |
| Wyoming | 129 | Apr 28 to Jun 24 | Aug 28 to Oct 10 | 0 |
Washington, D.C.
NOAA’s station names don’t list any station under D.C. The ZIP lookup matches D.C. ZIP codes to nearby stations, mainly NATL ARBORETUM DC (which NOAA’s name labels as MD), Washington Reagan Airport (VA) and Dalecarlia Reservoir (MD). All are within 8.2 km.
How we chose the stations
One station per map cell
We start from the same 6,949 stations the ZIP lookup uses: every NOAA station with all nine spring and fall 32°F dates present and not flagged as missing, insufficient or inconsistent. See methodology.
Big states have hundreds of stations, so each state page shows a main table of stations spread across the state, plus a full list of every station underneath. For the main table:
- Divide the state into 1° × 1° latitude/longitude cells, roughly 110 km north to south.
- In each cell, take one station. Prefer the most complete data (S over R over E), then major airport and weather-office stations (NOAA’s “USW” IDs), then the station nearest the cell’s center.
- Small states with fewer than 8 cells get topped up to 8 stations by the same preferences.
This spreads the table across mountains, plains and coast instead of piling it up around one city. It also means the main table won’t always include your city’s station. That’s what the full list and the ZIP lookup are for.
FAQ
Using frost dates
Where should I get my frost dates?
From the weather station nearest you, ideally at a similar elevation. Our ZIP lookup matches your ZIP code to the nearest qualifying NOAA station and shows its full 10% to 90% range, not just one date.
Which date should I plan with: 10%, 50% or 90%?
It depends on how much risk you’ll accept. NC State Extension calls the spring 10% date the low-risk, conservative choice and the 50% date the moderate one. For tender plants, plan around the 10% date.
Are frost dates reliable?
They’re averages of real station records, so they’re a good guide but not a promise. NC State Extension’s guide puts it plainly: “These probability levels capture past trends, but trends from the past might not correspond to what we will experience today or in the future.” Use them to pick a window, then check the forecast.
Changes and local differences
Are frost dates getting earlier or later?
In many places the first fall freeze is coming later. Climate Central’s 2025 analysis of NOAA data found it now arrives later in 179 of 204 U.S. cities (88%) than in the early 1970s, by 12 days on average. Our tables use the 1991-2020 normals, so they describe that 30-year period.
Does cold air settle in low spots?
Yes. Cold air drains downhill and pools, so a garden at the bottom of a slope can freeze when the station doesn’t. Our methodology page puts the difference for frost pockets, hillsides and lakeside gardens at “a week or more.”
Sources
- NOAA National Centers for Environmental Information, U.S. Climate Normals 1991-2020, annual/seasonal station normals (PRBLST, PRBFST, PRBGSL, PRBOCC fields, version 1.0.1).
- NOAA NCEI, Readme: By-Variable By-Station Normals Files (completeness and measurement flags). https://www.ncei.noaa.gov/data/normals-annualseasonal/1991-2020/doc/Readme_By-Variable_By-Station_Normals_Files.txt
- Station filtering, ZIP matching and data build date: methodology.
- NC State Extension, Interpreting Freeze / Frost Probabilities from the National Centers for Environmental Information, AG-873 (Nelson, El-Khoury and Boyette, reviewed Dec. 11, 2024). https://content.ces.ncsu.edu/interpreting-freezefrost-probabilities-from-the-national-centers-for-environmental-information
- Climate Central, Later First Freeze in 179 U.S. Cities (October 8, 2025). https://www.climatecentral.org/climate-matters/later-first-freeze-in-179-US-cities