Frost Odds by ZIP: Your Chance of Frost After Any Date
Most frost-date charts give you one date. Plant after it and you’re fine, right? Not quite. That single date is usually the median, the date when a frost later in the year is as likely as not. Plant on your “last frost date” and you’re flipping a coin.
The lookup on our homepage shows more than that: NOAA’s full spread of dates, from 10% to 90%. This article shows you how to read that spread as odds, so you can estimate the chance of a frost after any date you pick, not just the nine dates NOAA publishes.
TL;DR:
- Most charts’ “last frost date” is NOAA’s 50% date. One spring in two still has a 32°F night after it.
- NOAA’s 1991-2020 normals give nine spring dates per station, from 90% down to 10%. After the 10% date, only one spring in ten has another freeze.
- For downtown Denver (ZIP 80202), the 50% date is April 30 and the 10% date is May 13, two weeks later.
- For a date between two of NOAA’s, we draw a straight line between the two nearest dates and read the odds off it. That’s an estimate, not a NOAA figure.
What a “last frost date” actually means
How to read NOAA’s nine dates
NOAA’s 1991-2020 Climate Normals give, for each weather station, the spring date of the last 32°F night at nine probability levels (10%, 20%, … 90%). They give the same for fall’s first 32°F night, and both again at other thresholds. We read them the way NOAA’s traditional freeze tables do (see our methodology for the details):
- Spring, 10% date: there’s a 10% chance of a 32°F night after this date. It’s the latest of the nine.
- Spring, 50% date: a 50/50 chance of another freeze after it. This is what most charts call “the last frost date.”
- Spring, 90% date: a 90% chance of at least one more freeze after it. It’s the earliest.
The fall table works the other way round. The 10% date is the earliest, with a 10% chance the first freeze has already come by then.
Example: Denver
ZIP 80202 (downtown Denver) matches the NOAA station DENVER WATER DEPT (USC00052223), 2.7 km away, elevation 1,594 m. Its spring 32°F dates are:
| Chance of a 32°F night after this date | 90% | 80% | 70% | 60% | 50% | 40% | 30% | 20% | 10% |
|---|---|---|---|---|---|---|---|---|---|
| Date | Apr 15 | Apr 19 | Apr 23 | Apr 27 | Apr 30 | May 2 | May 4 | May 8 | May 13 |
So Denver’s “last frost date” is April 30. One spring in two, there’s still a freeze after it. To get down to one spring in ten, you have to wait until May 13, two weeks later. You can compare other stations in last frost dates by state.
Example odds for Denver
Odds for a few spring dates
This table shows the estimated chance of at least one more night at 36°F, 32°F and 28°F after each date at the Denver station above. We computed it with the method in the next section:
| Planting date | Chance of 36°F or colder after | 32°F or colder | 28°F or colder |
|---|---|---|---|
| April 15 | >90% | >90% | 60% |
| April 25 | >90% | 65% | 32% |
| May 1 | 80% | 45% | 18% |
| May 10 | 43% | 16% | <10% |
| May 15 | 27% | <10% | <10% |
| May 25 | 10% | <10% | <10% |
| June 1 | <10% | <10% | <10% |
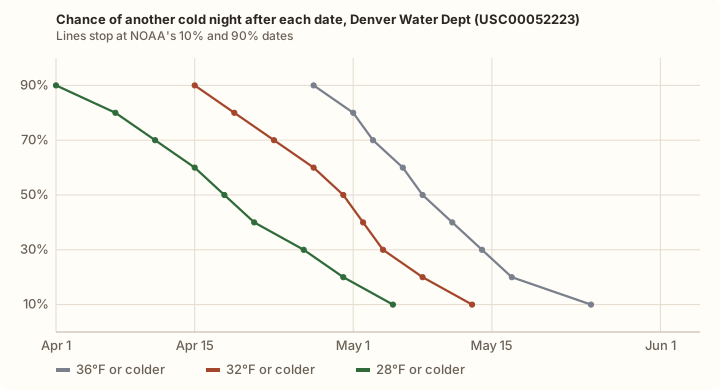
For comparison, Chicago O’Hare (USW00094846) is down to 10% for a 32°F night by May 1, but still at 40% for 36°F. Atlanta Hartsfield (USW00013874) is under 10% for 32°F after April 4.
How we compute the odds
NOAA publishes nine dates. Your planting date usually falls between two of them, so we draw a straight line between the two nearest dates (linear interpolation) and read the odds off it.
Example: Denver, May 10, at 32°F. May 10 falls between the 20% date (May 8) and the 10% date (May 13). It’s 2 days past May 8, out of a 5-day gap, so the estimate is 20% - (2/5 × 10) = 16%.
Three rules keep it honest:
- It’s an estimate. NOAA doesn’t publish odds for in-between dates, so the straight line is our assumption. NOAA builds its dates from 10,000 simulated years per station specifically to smooth out jagged results. Over a gap of a few days, a straight line should be a reasonable approximation, but it’s still an approximation.
- No extrapolation past the ends. After the 10% date we say “under 10%”, not 5% or 2%, because NOAA’s data stops there. Before the 90% date we say “over 90%”.
- Dates that cross New Year. In warm places some fall dates fall in January, and some spring dates fall in the previous December. We handle those so the dates stay in order.
Places where it doesn’t freeze every year
At some stations a 32°F night doesn’t happen every year. Think coastal California, south Texas, Florida. For these, NOAA also gives the percentage of years with a freeze at all, and we show it next to the dates. Sacramento Executive Airport (USW00023232), for example, has a 98.1% chance of reaching 32°F in a given year.
NOAA’s methodology document says: “The computation of frost-freeze date normals is based on conditional probabilities.” At these stations, the dates describe the timing if the temperature reaches the threshold at least once that cold season. To get the plain-English odds, multiply by the chance of a freeze at all. If a station freezes in only 40% of years and the conditional chance of a freeze after your date is 20%, the real chance is about 0.4 × 20% = 8%. Where a freeze happens in fewer than 10% of years, NOAA doesn’t publish dates at all.
Which station we use
The odds come from one weather station, the nearest qualifying NOAA station to your ZIP code. Across the 32,987 ZIP codes we can match, half are within 12.2 km of their station, 82% within 20 km and 98.8% within 40 km. If the nearest station is more than 80 km away, we don’t show dates.
We don’t adjust for elevation, so the result shows the station’s elevation for you to compare with your own. A garden in a frost pocket, on a hillside or near a large lake can differ from the station by “a week or more,” as our methodology page puts it. Cold air drains downhill and pools, so a low spot tends to run colder.
The normals are also a 30-year average, and seasons have been shifting. Climate Central’s 2025 analysis of NOAA data found that the freeze-free season lengthened in 172 of 198 U.S. cities (87%) since 1970, by 20 days on average in those cities. In practice, use the odds to pick a sensible window, then check the 7-day forecast before you plant anything tender.
32°F vs 28°F vs 36°F: which one should you use?
Frost, freeze and hard freeze
NOAA publishes frost dates at six thresholds, from 16°F to 36°F. We use three of them, 36°F, 32°F and 28°F, because they line up roughly with the National Weather Service’s frost and freeze alerts:
- 36°F: frost possible. Thermometers sit about 2 m (6.5 ft) above the ground. On clear, calm nights the ground and leaves can be colder than that, so frost can form even when the official low is 33 to 36°F. NWS offices issue Frost Advisories in that range. Use 36°F for tender seedlings and anything you’d hate to lose: tomatoes, peppers, basil, squash, beans.
- 32°F: freeze. This is the standard “last frost” in most charts. NWS issues a Freeze Warning when lows of 32°F or below are forecast.
- 28°F: hard freeze. The NWS glossary says “A hard freeze occurs when the surface air temperature reaches 28°F or lower for an extended period of time, killing most types of vegetation.” Hardy cool-season crops such as kale and cabbage can take several frosts, per University of Nebraska-Lincoln Extension, so 28°F is the more useful line for them.
For the Denver example, the difference is big. On May 10 the odds of 28°F are under 10%, of 32°F about 16%, and of 36°F about 43%.
If you’re planning fall crops instead, the fall planting countdown applies the same odds to sowing dates.
FAQ
Frost dates
Does the last frost date mean it won’t frost after that?
No. It’s usually the 50% date, so one spring in two still has a freeze after it. For tender plants, use a later date with lower odds, such as the 10% date.
Is it safe to plant tomatoes this weekend?
Look up your ZIP on our homepage, then estimate the odds for your planting date at 36°F with the method above, since tomatoes are tender and frost can form at 33 to 36°F. If the chance of 36°F or colder is still high, wait or be ready to cover them. Either way, check the 7-day forecast before you plant.
What’s the difference between a frost advisory and a freeze warning?
NWS offices issue Frost Advisories when lows of about 33 to 36°F are forecast, and a Freeze Warning when lows of 32°F or below are forecast. The Raleigh office’s criteria page lists both.
Temperatures
Does it have to be 32°F for frost?
No. The official temperature is measured about 2 m above the ground. On clear, calm nights, leaves and the ground can be colder than that, so frost can form when the official low is 33 to 36°F.
At what temperature does frost kill plants?
It depends on the plant. Tender crops can be damaged by any frost. The NWS uses 28°F for a hard freeze, which it says kills most types of vegetation. UNL’s guide puts the killing point of hardy vegetables near 20°F.
Sources
- NOAA National Centers for Environmental Information, U.S. Climate Normals 1991-2020, annual/seasonal station normals (frost/freeze probability fields PRBLST, PRBFST, PRBOCC). Details and station filter on our methodology page.
- NOAA NCEI, Normals Calculation Methodology 2020 (sections on frost-freeze probability dates: bootstrapped simulations, conditional probabilities). https://www.ncei.noaa.gov/data/normals-annualseasonal/1991-2020/doc/Normals_Calculation_Methodology_2020.pdf
- U.S. Census Bureau, 2020 ZCTA Gazetteer (ZIP code locations).
- National Weather Service glossary: “Freeze”, “Hard Freeze”. https://forecast.weather.gov/glossary.php?word=freeze
- NWS Tallahassee, Frost and Freeze Information (sensor height and frost at 33 to 36°F). https://www.weather.gov/tae/frost_and_freeze_info
- NWS Raleigh, Weather Criteria (Frost Advisory 33 to 36°F, Freeze Warning 32°F or below). https://www.weather.gov/rah/weathercriteria
- Climate Central, Longer Growing Season, Longer Allergy Season in 172 U.S. Cities (March 5, 2025). https://www.climatecentral.org/climate-matters/2025-allergy-season